What is sarcopenia, and how would you know if you were losing muscle?
Sarcopenia is the age-related loss of muscle strength and muscle mass, now classified as a muscle disease with its own diagnostic code. Clinics look for it with a grip test, a timed chair stand or short walk, and sometimes a body-composition scan. Expert groups agree that it matters and disagree about which measurement defines it.
- Strength falls faster than mass. Over three years in 1,880 older adults, leg strength declined between 2.6 and 4.1 percent a year while leg lean mass fell about 1 percent, roughly three times slower. In the same study, gaining lean mass was not accompanied by gaining strength.
- The current European consensus treats low muscle strength as the defining feature, uses low muscle quantity or quality to confirm it, and reserves the word severe for cases where physical performance is low too.
- Scan-measured muscle behaved differently from grip strength when both were tested against real outcomes. Pooling eight cohorts, 13,421 men and 4,828 women, low grip strength was associated with falls, hip fracture, mobility limitation and death with ratios generally between 1.2 and 3.0, while lean mass measured by scan was not consistently associated with any of them.
- How common sarcopenia is depends almost entirely on which definition you use. Across 109 articles and 58 cohorts, pooled prevalence in community-dwelling older adults ran from 9.9 percent under one definition to 40.4 percent under another.
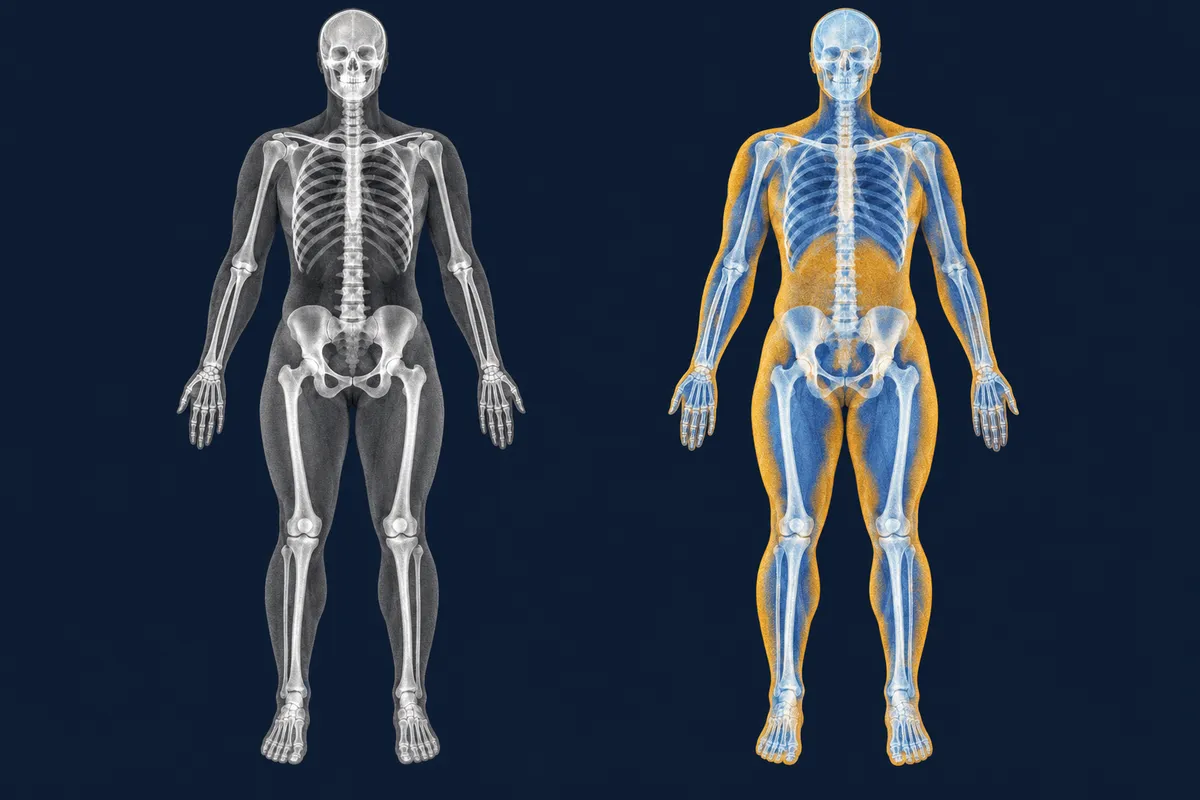
Same weight. Same clothes. Less muscle. After midlife the tissue under your skin reorganises without the scale reporting any of it, and the part that fades fastest is not the muscle itself but what the muscle can do: strength falls around three times faster than mass. That gap is where the word sarcopenia lives. It is also why the two obvious things to measure turn out to be worth very different amounts.
What the word actually means now
Sarcopenia is the loss of muscle strength and muscle mass that accumulates with age.
It is not a synonym for being thin, and it is not confined to the very old. The current European consensus describes it as a muscle disease rooted in adverse muscle changes that accrue across a lifetime, common among older adults but able to begin earlier. It carries an ICD-10 diagnostic code, which in some countries means care for it can be billed.
What changed in the most recent revision is which measurement comes first. The consensus now treats low muscle strength as the defining feature, on the grounds the consensus itself gives: that strength is a more dependable measure of muscle function than quantity is. Low muscle quantity or quality is used to confirm the diagnosis rather than to make it, and poor physical performance is what marks a case as severe. That produces three tiers a clinic may use in those words:
| Tier | What has been found |
|---|---|
| Probable sarcopenia | Low muscle strength on its own |
| Confirmed sarcopenia | Low strength, plus low muscle quantity or quality |
| Severe sarcopenia | Low strength, low quantity or quality, and low physical performance |
Picture a tow rope. Its thickness is the easy thing to measure, and for a while thickness is a fair guide to what it can pull. Now imagine that some of the strands inside have been swapped for a soft filler that holds the rope's shape but takes no load, and that a few more have worked loose at the hook. Nothing about the outside has changed. The rope still measures the same across, and it pulls less than it did.
That is roughly the distinction between muscle quantity and muscle quality. Quantity is how much muscle tissue there is. Quality covers the microscopic and larger-scale aspects of muscle architecture and composition, including fat that has settled inside the muscle, and it is assessed by imaging rather than by a tape measure or a scale. Two people carrying the same amount of muscle can produce different amounts of force, and the reason usually sits in that second column.
Why strength and mass came apart
Because they decline at different speeds, and the difference is large enough to change which one is worth measuring.
A study that followed 1,880 older adults for three years measured both. Leg strength fell by 3.4 percent a year in white men, 4.1 percent in black men, 2.6 percent in white women and 3.0 percent in black women. Leg lean mass over the same period fell by about 1 percent a year. Strength was going about three times faster than the tissue producing it.
The part of that study worth sitting with is the part that found nothing. Among participants whose lean mass went up, strength did not follow. The coefficients were negative and nowhere near significance in either sex: in men, minus 0.48 plus or minus 4.61, p equals 0.92; in women, minus 1.68 plus or minus 3.57, p equals 0.64. Adding muscle over those three years told you very little about what happened to strength.
Two plausible results, and they lead different places.
- A scan says your lean mass is normal; your grip is weak. The current consensus would call that probable sarcopenia and ask for a confirming measurement. The scan has not cleared you, because strength is the parameter the definition leads with.
- A scan says your lean mass is low; your grip and walking speed are normal. Under the current consensus that is not sarcopenia, because low quantity confirms a diagnosis rather than making one. It may still be worth tracking, and it is a different conversation from the first.
Signal and noise, stated plainly: if you only look at two numbers from this appointment, look at the strength measurement and the walking speed. The mass figure is the supporting evidence, not the finding.
Compare what’s included and what it costs.
How a clinic actually looks for it
Mostly with four short tests, none of which involve a machine you lie inside.
You squeeze a hand dynamometer, a small spring-loaded handle, two or three times with each hand. You rise from a chair five times without using your arms while somebody times it. You walk four meters at your ordinary pace. Some clinics start with a five-question form, SARC-F, which asks about strength, walking, climbing stairs, rising from a chair, and falls. A body-composition scan may be added to measure appendicular lean mass, which is the muscle in your arms and legs.
Translating the outputs, using the European consensus thresholds:
| Measurement | What it is | Low, by this consensus |
|---|---|---|
| Grip strength | Force from a hand dynamometer, in kilograms | Under 27 in men, under 16 in women |
| Chair stand | Seconds to rise from a chair five times | Over 15 seconds |
| Appendicular lean mass | Arm and leg muscle from a scan, in kilograms | Under 20 in men, under 15 in women |
| Appendicular lean mass for height | The same figure divided by height squared | Under 7.0 in men, under 5.5 in women |
| Usual gait speed | Meters per second over a short walk | 0.8 or below, treated as an indicator of severe sarcopenia |
| Short physical performance battery | A scored set of balance, walk and chair tasks | 8 points or below |
The questionnaire has a specific limitation worth knowing before you fill one in: SARC-F has low to moderate sensitivity and very high specificity for low muscle strength. In ordinary terms, a positive answer set is informative and a negative one is much weaker evidence, because the form is built to find clear cases and will miss milder ones. It is a case-finding tool rather than a test.
The instruments themselves are covered elsewhere and not repeated here. Grip strength and walking speed goes through what a dynamometer reading is worth and why the number moves when the device does. DEXA scans explains the two different exams clinics sell off one machine, and which of them produces a lean mass figure at all.
Whose cut-off? Three expert groups, three answers
This is the part that changes what a result is worth, which is why it sits here rather than at the end.
Three bodies have published thresholds for the same measurement, and they do not agree. The European consensus sets low grip strength at under 27 kilograms in men and under 16 in women. A project run through the Foundation for the National Institutes of Health, pooling nine studies and more than 26,000 participants, set it at under 26 kilograms in men and under 16 in women, with low arm and leg muscle at under 19.75 kilograms in men and under 15.02 in women. A later consortium, pooling eight prospective cohorts covering 13,421 community-dwelling men and 4,828 women, put the same threshold at under 35.5 kilograms in men and under 20 in women, alongside a walking speed under 0.8 meters per second.
A grip of 30 kilograms in a man is therefore normal under two of those definitions and weak under the third. Nothing about the hand changed.
That third analysis also carries a null worth reading closely. It tested low grip strength, low scan-measured lean mass for height, and slow walking against four outcomes: falls, hip fractures, mobility limitation and death, with follow-up running from one year for falls to about nine years for mortality. Low grip strength was associated with those outcomes, usually independently of slowness, in both sexes, with odds and hazard ratios generally between 1.2 and 3.0. Lean mass measured by scan was not consistently associated with them. The consortium's conclusion was that grip strength and walking speed belong in a summary definition of sarcopenia; the scan figure did not earn a place on the strength of those results.
The same disagreement shows up in how common the condition looks. A systematic review covering 109 articles, 58 unique cohorts, 26 countries and 656 individual prevalence estimates found pooled prevalence in community-dwelling older adults of 9.9 percent under one definition, 12.9 percent under another, 18.6 percent under a third, and 24.2, 30.4 and 40.4 percent under three definitions based on muscle mass alone. Within a single definition the spread was wider still: estimates using the European criteria ranged from 0 to 36.7 percent in men and from 0 to 62.2 percent in women across cohorts, with between-study heterogeneity above 87 percent for every definition but one.
So a clinic telling you that you do or do not have sarcopenia is telling you which definition it uses as much as it is telling you about your body. That is a reasonable thing to ask about directly.
What is associated with slowing it, and what the trials found
Exercise has the better evidence of the two things usually sold alongside a result, and the evidence is narrower than the marketing around it.
A systematic review by an international sarcopenia initiative looked at 19 intervention studies, 7 of exercise and 12 of nutrition. Physical performance improved in most of the trials that measured it, and muscle strength improved as well. Muscle mass was the outcome that held up least often: it increased in 3 of the 7 exercise studies. The review's own summary of the field was that solid evidence on which to base recommendations for patients with sarcopenia is not available.
Protein supplements are the other half of that review, and the result is a clean negative. Its five moderate to high quality protein studies failed to show a consistent effect on muscle mass or function. A later meta-analysis of 36 randomized controlled trials covering 1,682 non-frail community-dwelling older adults tested five outcomes: lean body mass, handgrip strength, lower extremity muscle strength, gait speed and chair rise ability. None of the five reached significance against control. The authors' reading was that most participants were already eating enough protein, which is a different claim from protein not mattering, and it leaves the question open for people whose habitual intake is low.
The background rate is worth having as well. Muscle mass and strength peak somewhere around 30 to 35 years of age, then decline slowly and fairly steadily at first and faster after about 65 in women and 70 in men. Around 30 percent of adults over 70 report difficulty walking, rising from a chair or climbing stairs. That average decline can be substantially slowed by staying active, according to the National Institute on Aging, and slowed is the accurate word there rather than stopped.
One boundary, because it is easy to lose. Muscle strength is associated with better long-term outcomes. Measuring your grip is associated with nothing at all: the dynamometer is a ruler, and no ruler has ever moved the thing it measures. What a measurement can do is tell you where you are standing and give a later measurement something to be compared against.
Before you book
Worth asking, in an email, before you pay for anything:
- Which definition do you use, and what are your cut-offs? Three sets are in circulation and they disagree by a wide margin at the same grip. A clinic that can name its thresholds has thought about this.
- Which measurements are included? A strength test and a walking or chair-rise test are the ones the current consensus leads with. A body-composition scan on its own does not establish the diagnosis.
- If a result comes back low, what happens next? A measurement that changes nothing about the plan is a measurement you can decline.
- Will a retest use the same device and the same protocol? Grip readings move with the dynamometer model and with hand position, so a comparison across two different devices is not a clean comparison.
- Who reviews the result with me, and what are their qualifications?
Two limits to hold on to. A normal set of results here describes your muscle function on the day of the test; it does not rule out anything else, and it says nothing about the screening you are due for by age and risk. And this sits outside guideline-directed care rather than inside it, which is a reason to be clear about what you want from it rather than a reason to avoid it.
Common questions
Is sarcopenia just a medical word for getting weaker with age?
Close, but it is narrower than that. It refers specifically to the loss of muscle strength and muscle mass, and the current European consensus describes it as a muscle disease with a diagnostic code rather than as an inevitable background process. It is common in older adults and is now recognized as something that can begin earlier in life.
Can a body-composition scan tell me whether I have it?
Not on its own. The current consensus leads with muscle strength and uses muscle quantity or quality to confirm the diagnosis, so a scan supports a finding rather than making one. In a pooled analysis of eight cohorts, scan-measured lean mass was not consistently associated with falls, hip fracture, mobility limitation or death, while grip strength was.
My grip was called normal at one clinic. Would another clinic agree?
Possibly not. Three expert groups publish different thresholds for low grip strength in men: under 27 kilograms, under 26 kilograms, and under 35.5 kilograms. A reading between those figures is normal by one definition and low by another, so it is worth asking which cut-offs a clinic uses.
Will taking more protein help?
The trials in generally well-nourished older adults did not show that it does. A meta-analysis of 36 randomized controlled trials in 1,682 non-frail community-dwelling older adults found no significant effect on lean body mass, grip strength, lower extremity strength, gait speed or chair rise ability. The authors noted that most participants were already eating enough protein, which leaves the question open for people whose intake is low.
If my results are normal, am I fine?
A normal result describes your muscle strength and function on the day it was measured. It does not rule out other conditions, and it does not stand in for the screening you are due for by age and risk. It is most useful as something a later measurement can be compared against, provided the retest uses the same device and protocol.
Prepared by the LongevityClinicsHub editorial team. Evidence last checked September 2026. How we research and source these guides.
Enter your ZIP code and we’ll point you at the nearest city we’ve researched.
Keep reading
Sources
- Cruz-Jentoft AJ, Bahat G, Bauer J, et al. Sarcopenia: revised European consensus on definition and diagnosis. Age and Ageing 2019;48(1):16 to 31. The definition, the three tiers, the quantity and quality distinction, SARC-F as a case-finding tool, and every threshold in the cut-off table.
- Goodpaster BH, Park SW, Harris TB, et al. The loss of skeletal muscle strength, mass, and quality in older adults: the Health, Aging and Body Composition Study. The Journals of Gerontology Series A 2006;61(10):1059. The 1,880 adults over three years, the annualised decline figures, and the lean-mass-gain null with its coefficients.
- Cawthon PM, Manini T, Patel SM, et al. Putative cut-points in sarcopenia components and incident adverse health outcomes: an SDOC analysis. Journal of the American Geriatrics Society 2020;68(7):1429 to 1437. PMID 32633824. The eight cohorts, the ratios between 1.2 and 3.0, the scan-measured lean mass null, and the 35.5 kilogram cut-point.
- Bhasin S, Travison TG, Manini TM, et al. Sarcopenia definition: the position statements of the Sarcopenia Definition and Outcomes Consortium. Journal of the American Geriatrics Society 2020;68(7):1410 to 1418. PMID 32150289. The conclusion that both weakness and slowness belong in a definition.
- Mayhew AJ, Amog K, Phillips S, et al. The prevalence of sarcopenia in community-dwelling older adults: a systematic review and meta-analyses. Age and Ageing 2019;48(1):48. The 109 articles and 58 cohorts, the pooled prevalence spread, and the within-definition range.
- Cruz-Jentoft AJ, Landi F, Schneider SM, et al. Prevalence of and interventions for sarcopenia in ageing adults: a systematic review. Age and Ageing 2014;43(6):748. The 19 intervention studies, muscle mass increasing in 3 of 7, and the protein null.
- Ten Haaf DSM, Nuijten MAH, Maessen MFH, et al. Effects of protein supplementation on lean body mass, muscle strength, and physical performance in nonfrail community-dwelling older adults: a systematic review and meta-analysis. The American Journal of Clinical Nutrition 2018;108(5):1043 to 1059. PMID 30475963. The 36 trials, the 1,682 participants, and the five outcomes that did not reach significance.
- National Institute on Aging. How can strength training build healthier bodies as we age? The peak at 30 to 35, the faster decline after 65 and 70, and the 30 percent figure for adults over 70.
- National Institute on Aging. Research consortium including NIH proposes diagnostic criteria for sarcopenia. The Foundation for the NIH project, its nine studies and 26,000 participants, and its thresholds.
This guide is independent editorial content, written to orient, not to diagnose. It is not medical advice, and it is no substitute for a conversation with a licensed physician who knows your history. Where we describe what clinics claim, the claim belongs to the clinic.
Educational reading, not medical advice. Talk to a clinician about your own health.